Classifying nitrogen in cucumber leaves with hyperspectral imaging and machine learning
Researchers tested whether combining hyperspectral imaging with machine learning models could accurately categorize varying nitrogen fertilizer levels in cucumber leaves. By identifying specific spectral bands from plant samples, the setup reached high classification accuracy, pointing to potential improvements for agricultural nutrient management.
Reviewed by Matheus Grangeiro
- Peer reviewed
- Yes
- Sample size
- 300
Key numbers
30%
additional nitrogen treatment
60%
additional nitrogen treatment
90%
additional nitrogen treatment
2g L⁻¹
base concentration of nutrient solution
300leaves
total leaves collected from treated plants
400-1100nm
spectral range for hyperspectral images
327spectral bands
number of spectral bands produced for each sample
75/25%
training-testing split ratio
Evidence level: Observation or measurement
Why it matters: Nitrogen management is among the most consequential decisions in vegetable production: too little stunts growth; too much accumulates as nitrate in edible tissue, poses human health risks, and leaches into groundwater. Standard diagnostic practice relies on Kjeldahl digestion or colorimetric tissue assays — procedures that are destructive, laboratory-bound, and too slow to inform in-season fertigation decisions. A non-destructive optical system capable of classifying nitrogen status directly from leaf spectral signatures would shift nutrient monitoring from reactive chemistry to real-time agronomic intelligence, reducing both input waste and the environmental burden of nitrogen runoff.
How Hyperspectral Imaging Categorizes Nitrogen Levels in Cucumber Leaves
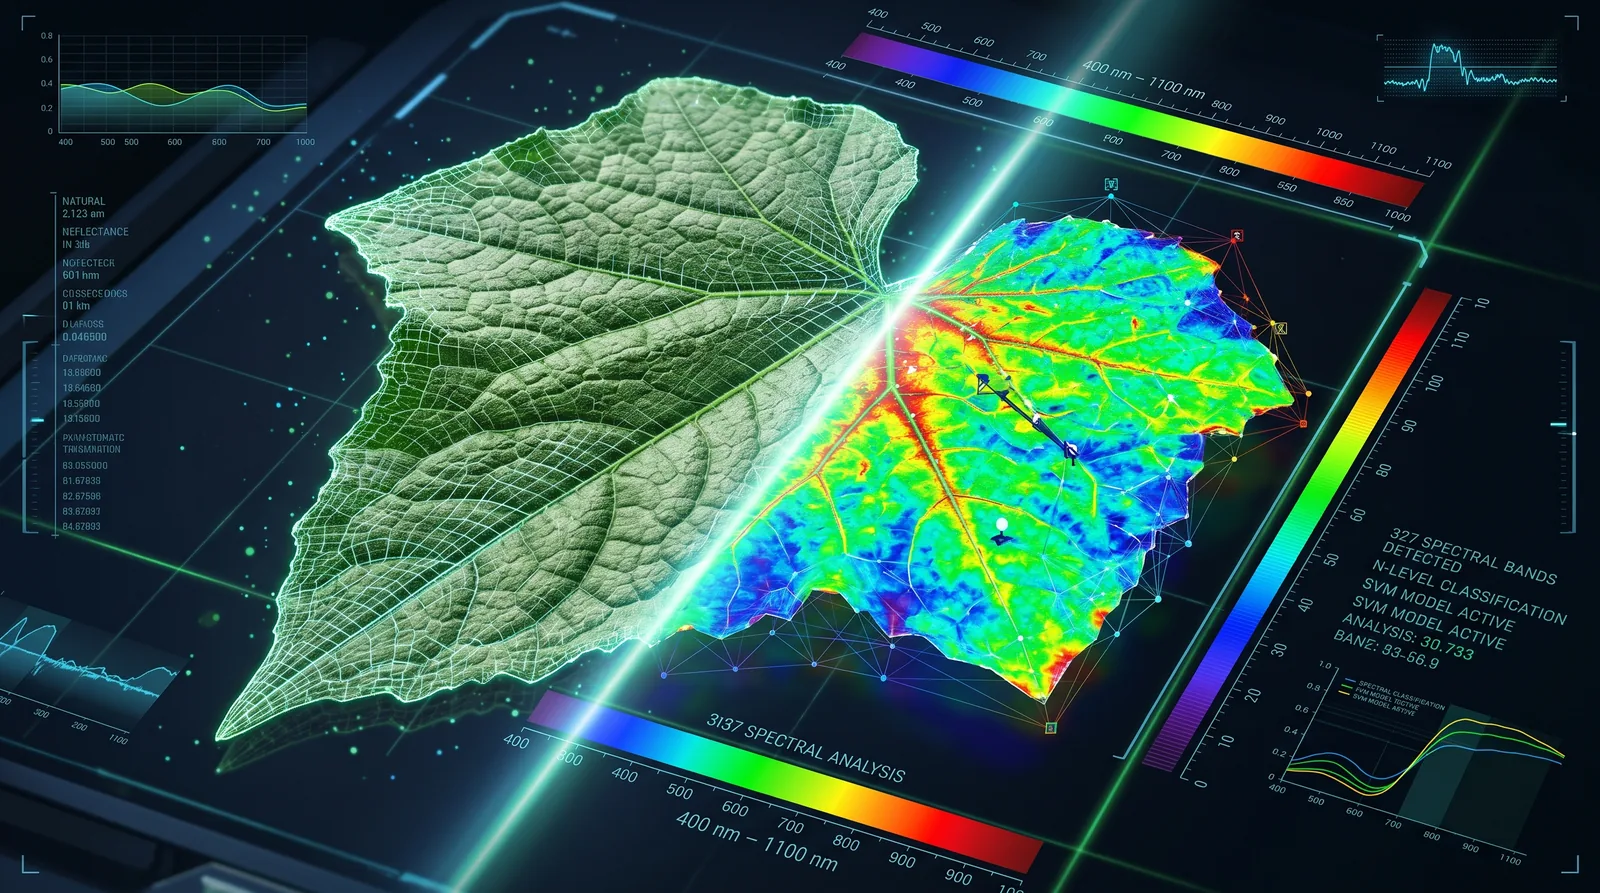
The experimental design centers on the Super Arshiya-F1 cucumber cultivar, treated with three levels of nitrogen excess — 30%, 60%, and 90% above a standard base solution concentration of 2 g/L — alongside an untreated control. Three days after treatment application, 300 leaves were harvested from the plants and subjected to hyperspectral imaging across a spectral window of 400 to 1,100 nm, yielding 327 distinct spectral bands per sample. This wavelength range encompasses both the visible region, where chlorophyll absorption features encode nitrogen-related greenness signals, and the near-infrared region, where leaf structural properties and water content contribute secondary diagnostic information.
Three preprocessing techniques were evaluated to improve signal quality and assess their influence on class separation: Savitzky-Golay filtering, which suppresses high-frequency spectral noise while preserving band shape; Multiplicative Scatter Correction, which corrects for path-length variation and scattering differences between samples; and Gaussian normalization, which standardizes the intensity distribution of each spectrum. Critically, preprocessing was fitted exclusively to training data and then applied to the independent test set, preventing information leakage and ensuring that reported metrics reflect genuine generalization rather than optimistic in-sample estimates. Model selection used a 75/25 training-to-testing split with 5-fold cross-validation on the training partition.
What the Study Shows Versus What Remains Untested in the Field
Three classifiers were benchmarked: Support Vector Machine (SVM), Linear Discriminant Analysis (LDA), and Decision Tree. SVM consistently achieved the highest classification performance across all tested configurations — a result consistent with the broader hyperspectral-agricultural literature, where SVM’s kernel-based separation of high-dimensional spectral spaces typically outperforms linear and tree-based alternatives on small-to-moderate sample sizes. Notably, the top-performing configurations were achieved either without any preprocessing or with Gaussian normalization alone, suggesting that the informative spectral contrast between nitrogen treatment classes is sufficiently robust to survive without scatter correction, and that over-processing can attenuate rather than enhance the discriminative signal.
The leading SVM configurations achieved an overall classification accuracy of 94%, an F1-score close to 0.94, and a ROC-AUC exceeding 0.98. The ROC-AUC value is particularly informative: a score above 0.98 across a four-class problem indicates that the classifier separates the nitrogen treatment levels with high reliability at all decision thresholds, not merely at the operating point that maximizes accuracy. LDA displayed moderate performance, while Decision Tree produced the lowest accuracy among the three — an expected outcome given Decision Tree’s susceptibility to overfitting on spectral data with high inter-band correlation.
Analyzing the Trade-Offs of Optical Nitrogen Classification
The 94% classification accuracy reported here situates this study competitively within the hyperspectral nitrogen sensing literature, where SVM-based models on cucumber and related leafy crops have reported correct classification rates between 82% and 96% depending on sample size, cultivar, and spectral range. The strength of the ROC-AUC metric (>0.98) is particularly notable because it is threshold-independent, meaning the classifier would retain high separability even if the optimal decision boundary shifted under slightly different growing conditions. Together, these metrics suggest that the spectral contrast between 30%, 60%, and 90% excess nitrogen treatments is well-structured in the 400–1,100 nm range and exploitable by kernel-based classifiers without extensive preprocessing.
The critical limitation is scope: all measurements were taken three days post-treatment under controlled greenhouse conditions, from a single cultivar, with leaves harvested at a single developmental stage. Nitrogen status interacts with leaf age, plant growth stage, ambient light during acquisition, and water status — none of which varied in this study. The 300-leaf sample size, while adequate for demonstrating feasibility, is modest relative to the variability encountered across a commercial growing cycle. These constraints do not diminish the technical validity of the classification results, but they define precisely the gap between laboratory proof-of-concept and deployable field tool.
What Is Still Unknown About Deploying the Model Outdoors
Field deployment would require resolution of several interconnected challenges that the current study does not address. The cost and logistical footprint of hyperspectral imaging hardware — typically requiring line-scan pushbroom systems with controlled illumination — remains uncharacterized in operational agricultural terms; whether this technology is cost-competitive with periodic laboratory tissue testing depends on throughput, equipment amortization, and the economic value of earlier intervention. Beyond hardware, it remains untested how spectral models trained on controlled-illumination greenhouse imagery generalize to outdoor conditions, where solar angle, cloud cover, and canopy geometry introduce spectral variability that is absent from the training distribution. Performance across different nitrogen application timings, growth stages, and cultivars is similarly unestablished, as is the question of whether a model trained on three days post-treatment data retains accuracy at earlier or later sampling windows.
Verdict: Under controlled laboratory conditions, combining hyperspectral imaging with Support Vector Machine (SVM) modeling achieves 94% classification accuracy and an ROC-AUC above 0.98 for distinguishing nitrogen levels in cucumber leaves. However, generalization to field conditions, diverse growth stages, and varied cultivars remains to be demonstrated.
Based on reporting from Scientific Reports. This is an independent explainer, written in our own words with AI assistance; Scientific Reports has not reviewed or endorsed it. Read the original for the full details.